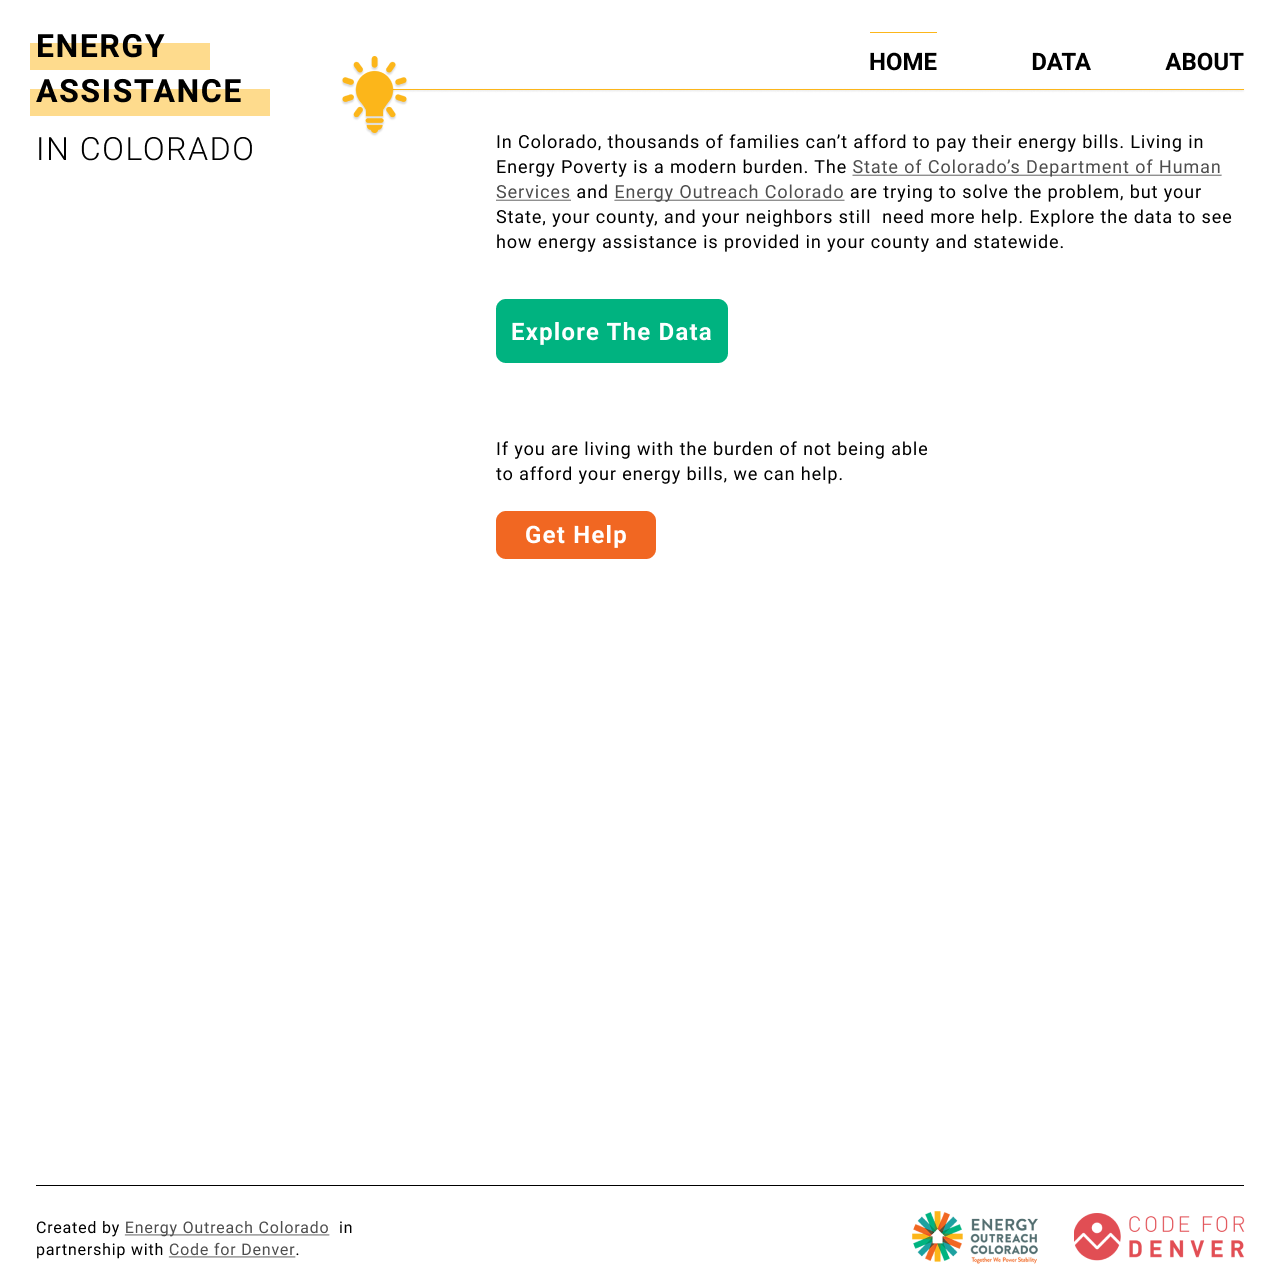
Energy Assistance Dashboard
Statewide visualization of energy poverty data.
// overview
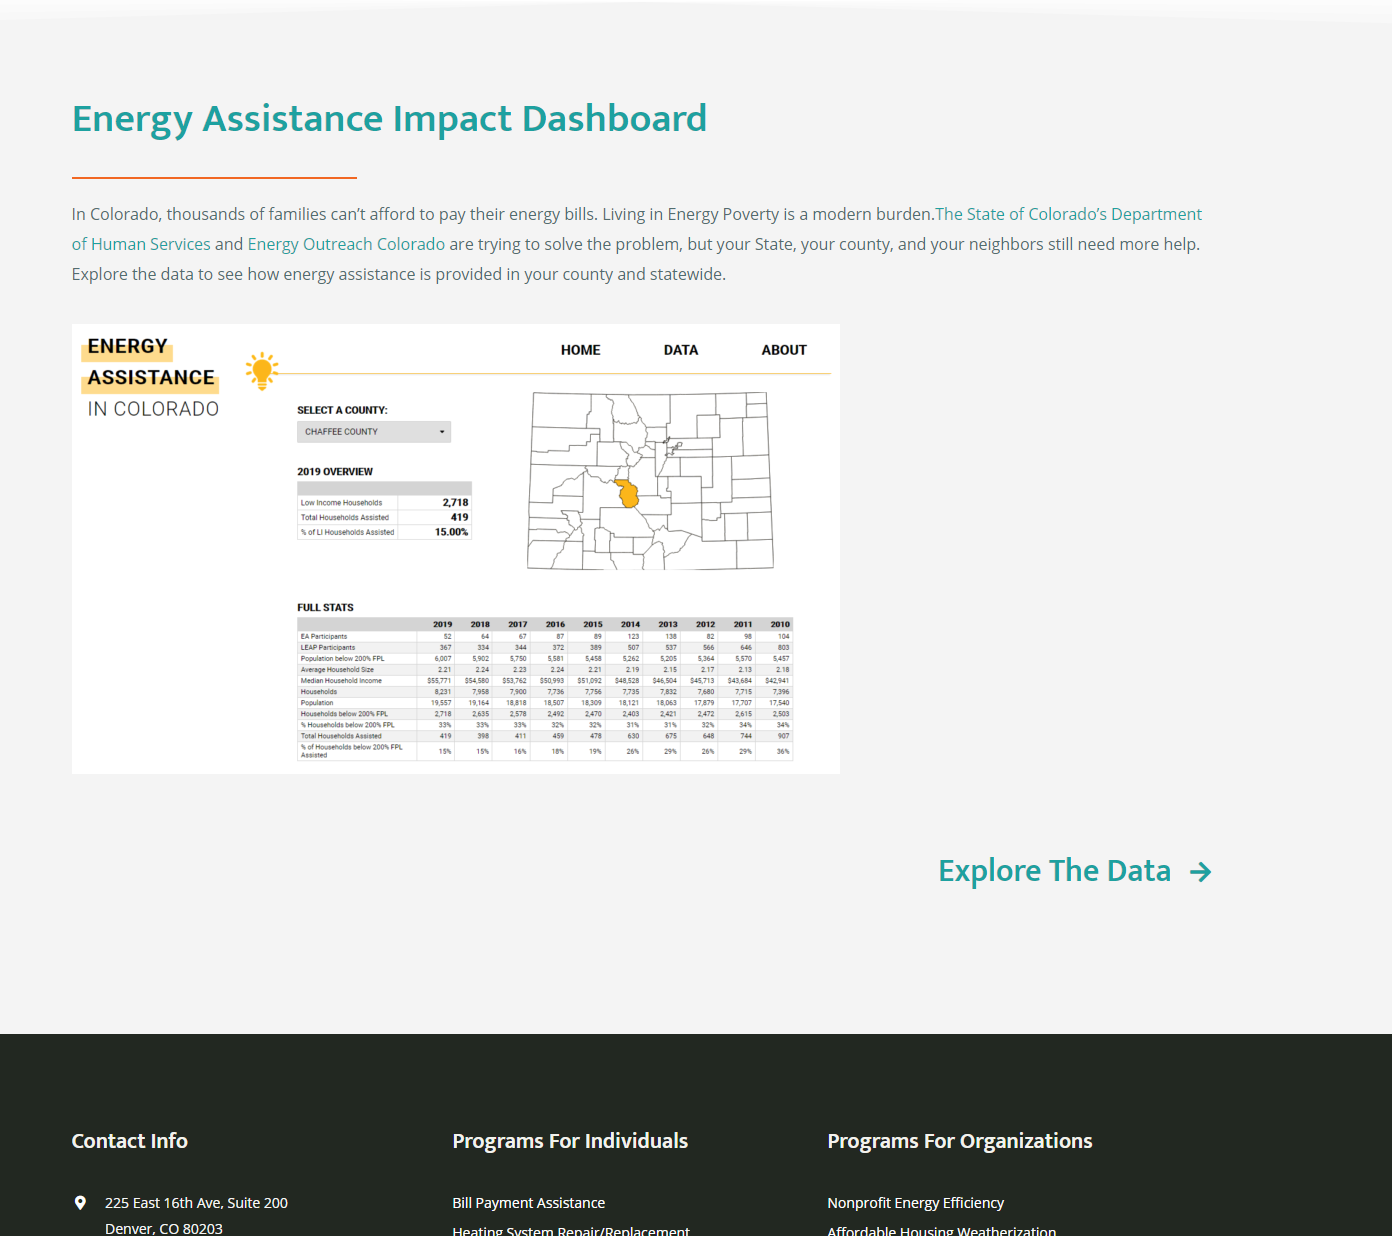
A comprehensive, statewide data visualization tool that makes energy poverty statistics and related insights accessible to policymakers, advocates, and the public.
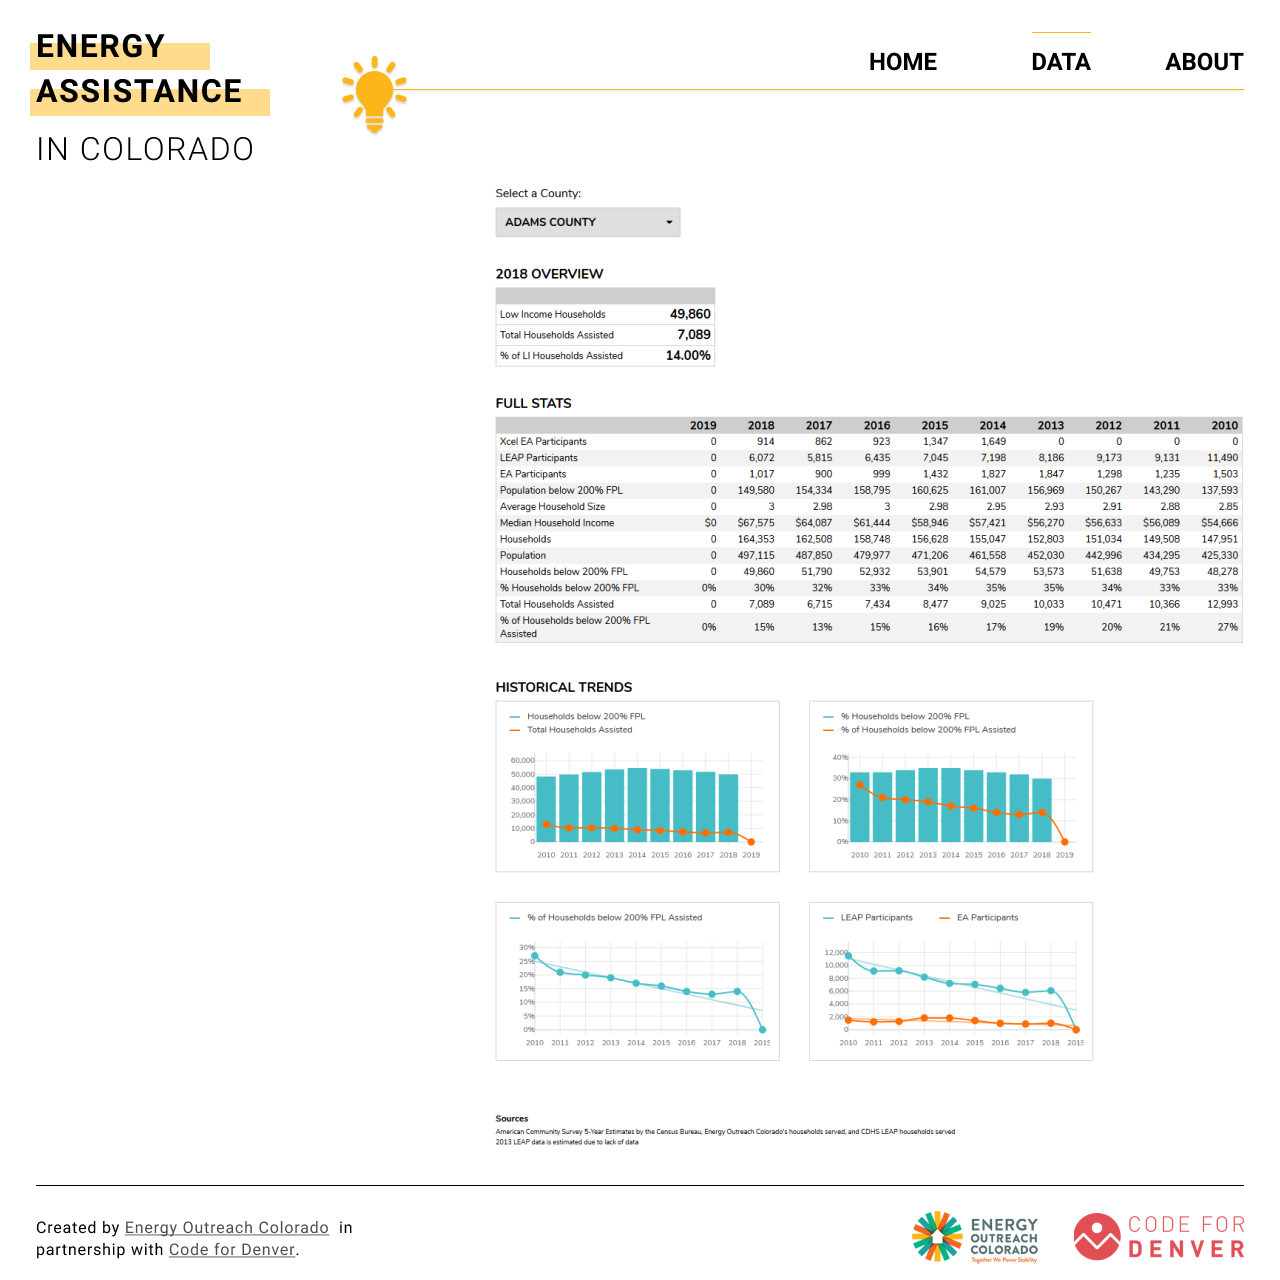
This interactive dashboard displays energy poverty statistics and related socioeconomic data at multiple geographic levels, enabling stakeholders to understand and address energy inequality.
// solution
The solution combines intuitive UX design for diverse user skill levels with strategic data priorities and comprehensive data analytics. We cleaned, processed, and validated energy poverty datasets for visualization, creating a dashboard that serves policy advocates, government agencies, and nonprofits.
Our approach prioritized data visualization design for public sector audiences, stakeholder engagement in policy technology, complex data transformation and storytelling, and accessibility and inclusive design principles.
By designing the Energy Assistance Dashboard, I made complex energy poverty data understandable and actionable for policymakers and advocates, supporting evidence-based policy decisions and resource allocation that address energy inequity.
// screenshots